

For this exploration we will take a look at various graphs of ![]()
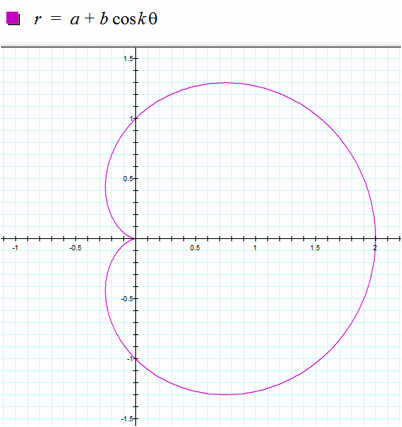
Here is the common n-leaf rose, where a = b = k = 1 and 0 ≤ θ ≤ 2π
Here is another example this time a = b = k = 3
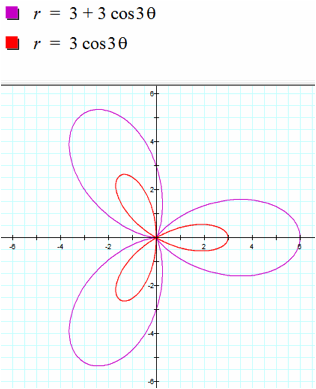
Looks like we have 3 petals for each graph.
What about for a = b = k = 5:
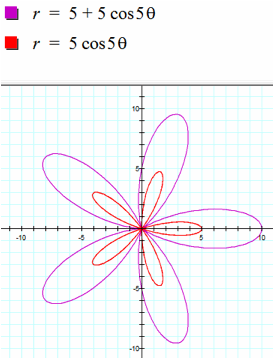
We have 5 petals, there seems to be a pattern forming…
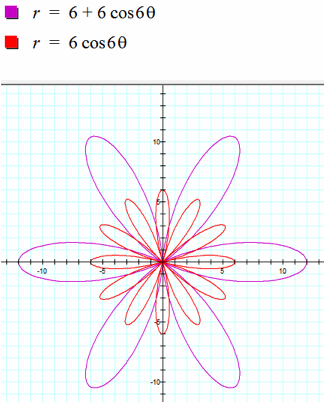
Something different happened than expected, which makes me think there could be a difference in odd and even values for k…?
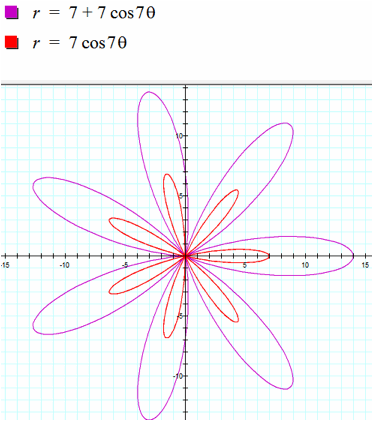
Looks like when the values are the same and odd, the two graphs are similar, and when the values are even, the second graph has twice the number of petals as k.
Let’s go back to the first equation and vary the value for a keeping b and k constant to see what happens:
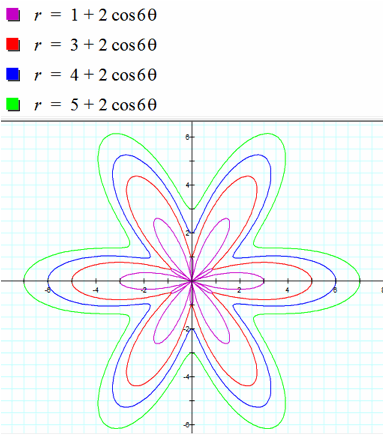
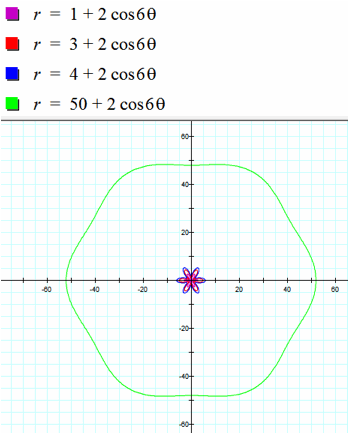
As the values for a increase, the graph moves further outward and begins to lose the shape of the flower.
Here is another example:
Now let’s try changing the values for b, while keeping a and k constant:
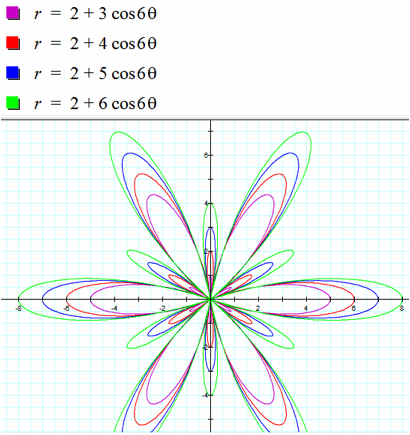
There seems to be a difference in the graphs when a < b, they meet at the origin, but when a > b, the graphs begin to move away from the origin.
What if we used sine instead?
Here are some side by side examples of replacing cosine with sine:
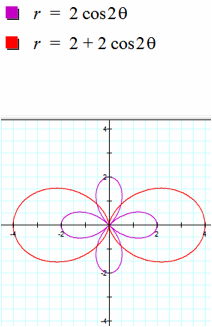
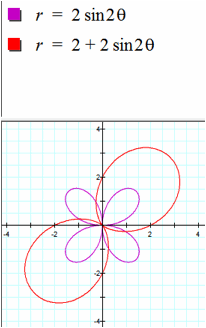
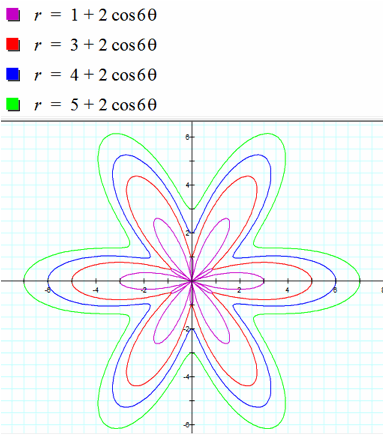
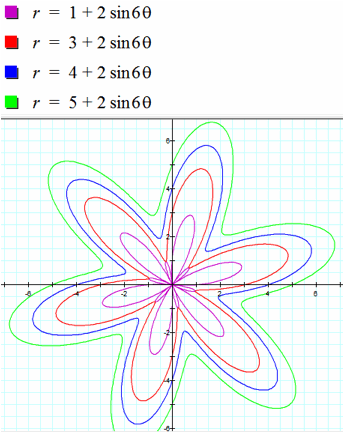
It looks like the properties for a,b, and k are the same and the graphs are just slight rotations of each other.